Building a BI platform when the business starts in Excel
Why the first job was not choosing a framework, but identifying which spreadsheet represented each business truth.
Read note →Business systems for real operations
I turn fragmented Excel files, ERP exports, inventory reports and financial workflows into practical internal systems using business-first thinking and AI-assisted development.
What I solve
The interesting part is rarely the dashboard. It is understanding why five sources disagree, which business rule is authoritative, and what action the user needs next.
Connect supplier DMS data, accounting exports and customer mappings into repeatable reporting flows.
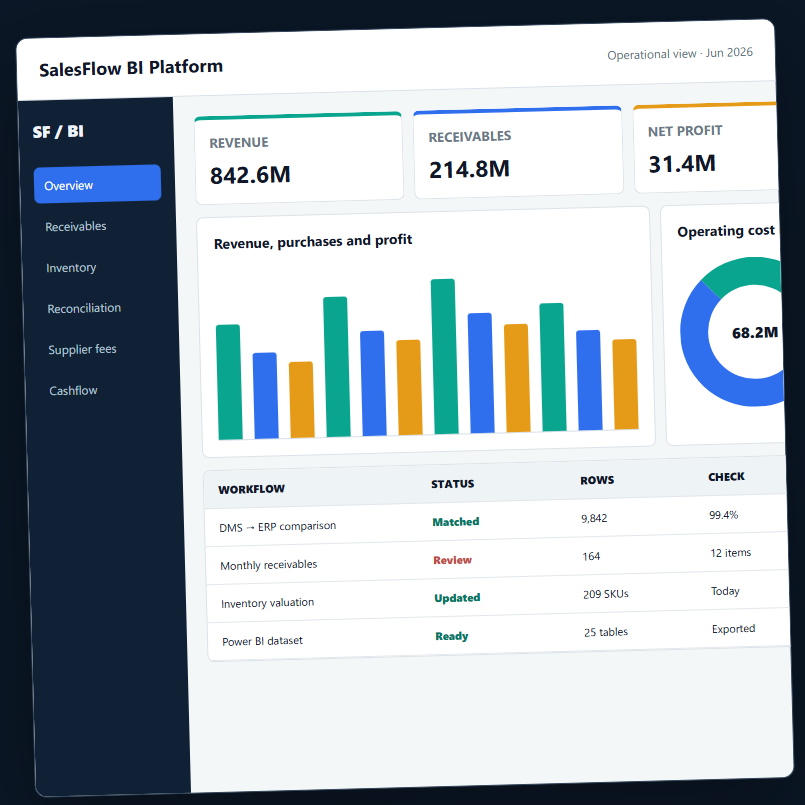
Bring receivables, cash balances, expenses, inventory and profit logic into one decision surface.
Find mismatches between operational systems before they become accounting or collection problems.
Normalize product codes, units and pricing rules to explain stock movements and valuation.
Design focused interfaces for repeated work: upload, validate, review exceptions and export actions.
Turn application logic into clean fact and dimension tables ready for Power BI analysis.
My thinking
Many people believe building dashboards is difficult. I believe the difficult part is understanding business logic.
Technology changes. Business workflows remain. I begin by understanding how a business makes decisions, where its data disagrees and what must be trusted before choosing an implementation.
Flagship project
A production internal platform for a distribution business, bringing sales, receivables, inventory, supplier settlement, cashflow and ERP reconciliation into one workflow.
Every reporting cycle began with multiple files that had to be reconciled manually before the business could trust the numbers.
System flow
Human × AI delivery model
The work moves quickly because responsibilities are explicit, not because judgment is outsourced.
Identify the operating pain and decision that needs support.
Map actors, timing, sources, exceptions and desired actions.
Define identifiers, authority, ownership and calculation meaning.
Shape a practical system around real constraints and future options.
Generate, refactor and document the application under direction.
Validate with real files and investigate every material mismatch.
Turn usage feedback into safer rules, faster flows and clearer UI.
Deploy, operate and remain accountable for the system outcome.
Field notes
Short, honest notes from building systems around imperfect operational data.
Why the first job was not choosing a framework, but identifying which spreadsheet represented each business truth.
Read note →A single ERP summary row produced a multi-billion receivable and taught a durable lesson about validation.
Read note →Monthly debt, delivery-only customers and unit conversion made the visual layer the easy part.
Read note →