Flagship case study
Turning fragmented ERP exports into an internal decision platform.
An AI-assisted BI and automation system built around the daily reality of a small distribution business.
Every reporting cycle started with files that disagreed.
Supplier sales lived in DMS. Accounting records came from MISA. Customer collection types were maintained in a mapping workbook. Bank and cash transactions arrived in separate exports. Inventory and sell-in data used different product codes and units.
The work was not simply “make a dashboard.” Before a number could be trusted, the business had to answer which source was authoritative, which customers represented owned sales, which were delivery-only, and how monthly collections related to previous-month receivables.
DMS.xlsmSupplier sales, products, promotions, channels and orders.
Ban_hang.xlsxMISA sales, payment status, invoices and receivables.
Customer mappingCustomer code, channel and collection/delivery classification.
Bank & cashCollections, expenses, balances and reconciliation evidence.
Sell-in filesPurchases, supplier discounts, product and unit details.
Inventory reportsMISA and supplier stock snapshots for comparison.
Before / After
The change was operational, not cosmetic.
No invented time-saving metric: the comparison focuses on observable workflow changes.
Before
- Multiple exports reviewed separately
- Repeated Excel filtering and pivot checks
- Receivables mixed with delivery-only activity
- Product and unit mappings held in memory
- Reports recalculated from raw history
- Different logic across operational reports
After
- One exception-driven reporting workflow
- Monthly overview with detail on demand
- Owned receivables and delivery debt separated
- Canonical customer and product mappings
- Closed-month snapshots with fast refresh
- Shared rules for web and Power BI outputs
The business rules were the product.
The key design decision was to model the way the business actually reviews operations: monthly first, document-level only when a total does not match.
- Receivables are grouped by unique customer code, never customer name.
- Delivery-only customers are visible but excluded from owned receivable assets.
- Bank reconciliation prioritizes customer-month totals before individual invoices.
- Inventory decreases only for owned-sale customers; samples still reduce stock.
- Product pack and unit codes are normalized before quantity comparison.
- Supplier price variance is tracked for settlement, not counted as operating profit.
- Net profit combines standard margin, purchase discount, delivery fees, samples and operating costs.
Interesting challenges
The edge cases that shaped the platform
These were not UI problems. Each one changed the meaning of a business number.
Customers with the same name
Delivery-only customers
Collections paid in another month
Pack and unit product codes
Full-dump files every day
Concurrent heavy reports
03 · Solution
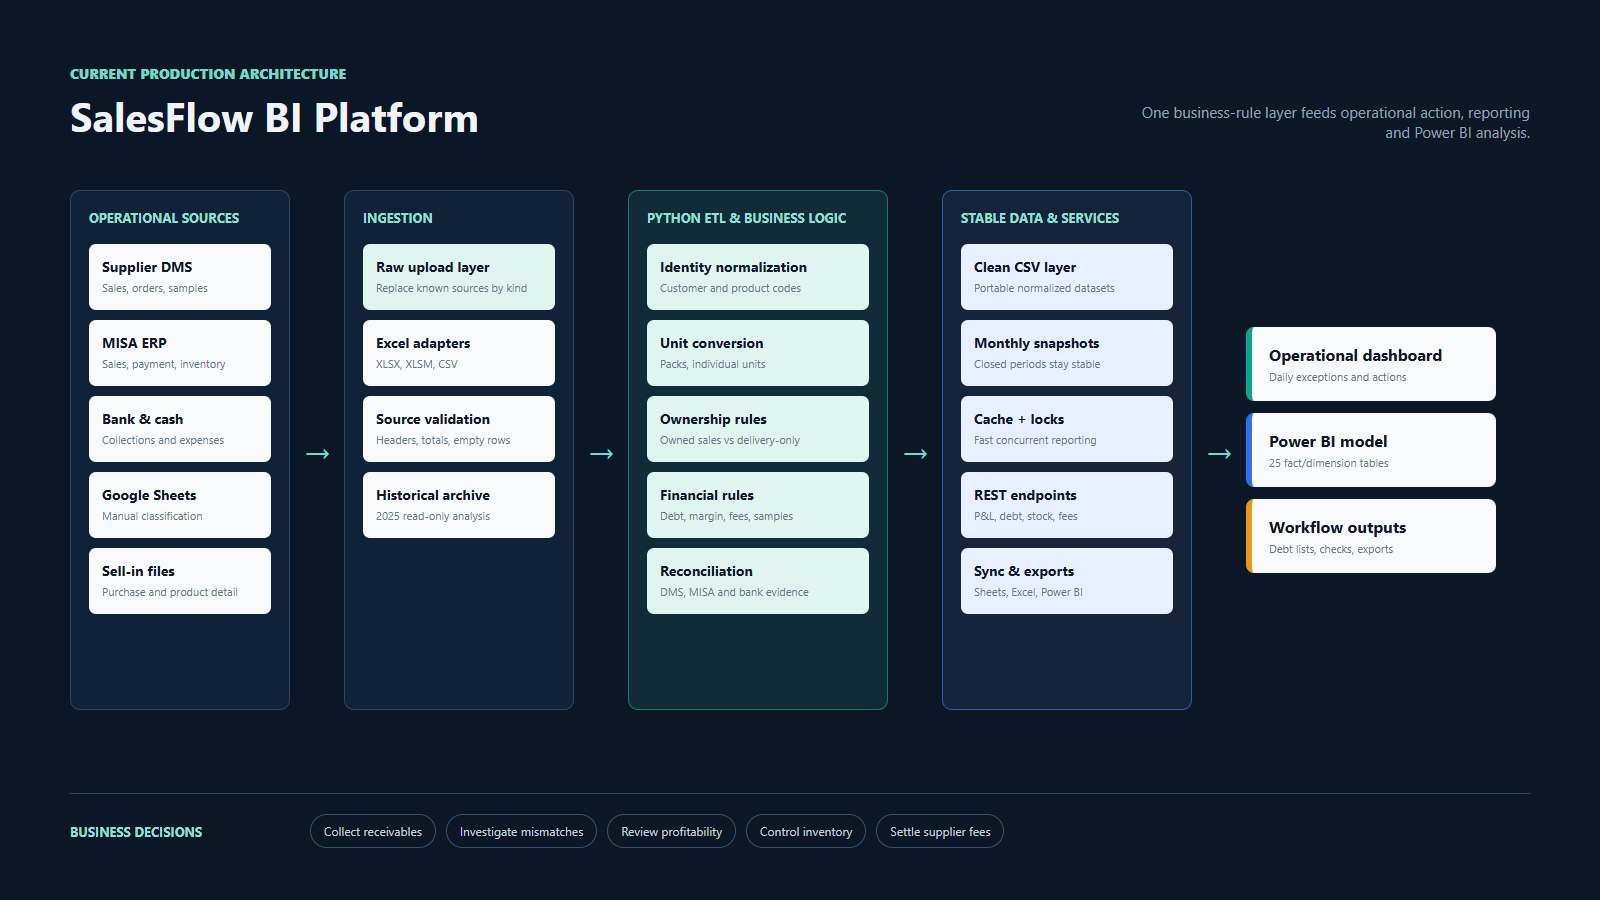
One platform, thirteen operational views
Each module answers a specific operating question and shares the same normalized data layer.
Designed for files today, extensible to APIs tomorrow.
The platform accepts the files the business already knows how to export. Python normalizes those files into stable CSV datasets, freezes closed months, calculates business metrics behind API endpoints and exports a separate semantic layer for Power BI.
Project evolution
From first prototype to production platform
The feature set emerged from actual use, not a one-time specification.
First prototype
Four source files, filters, receivables and bank matching.
Operational reporting
Persistent uploads, monthly debt, CRM and DMS comparison.
Inventory & profit
Sell-in, product mapping, stock valuation and supplier rules.
Finance & deployment
Google Sheets sync, cashflow, mobile UI and Hawkhost.
BI & reliability
Snapshots, cache locking, 2025 analysis and Power BI model.
05 · Contribution
Human ownership, AI acceleration
My contribution
- Mapped the real operating workflow
- Defined source authority and business rules
- Specified reports and exception handling
- Validated numbers against real files
- Prioritized features from daily usage
- Deployed, tested and iterated the system
AI contribution
- Generated implementation scaffolding
- Accelerated Python and frontend delivery
- Helped investigate data mismatches
- Produced tests and deployment support
- Refactored portability and caching
- Acted as an always-available engineering partner
A repeatable reporting workflow instead of repeated spreadsheet archaeology.
The platform centralizes previously fragmented reporting, shortens the path from raw exports to exceptions, preserves monthly history and gives both operational and BI views the same business logic.
The outcome is not a dashboard screenshot. It is a business process that can be repeated, checked and improved.